On this topic of custom dashboards, there are many blogs published and many details are covered in those blogs. Especially Brock Peterson’s blogs are most useful for understanding this topic. Highly recommend viewing his collection of many different custom dashboards, which you can import and tryout in your lab or for your customer use case. This post is an inspiration from his great blogs.
In this post, we will create a custom dashboard provides a single, VM-centric view that replaces the default VM summary with deeper, more actionable insights for day-to-day operations. This dashboard helps administrators to quickly understand the current state of a virtual machine, identify performance or capacity risks, and take proactive action before issues impact the business.
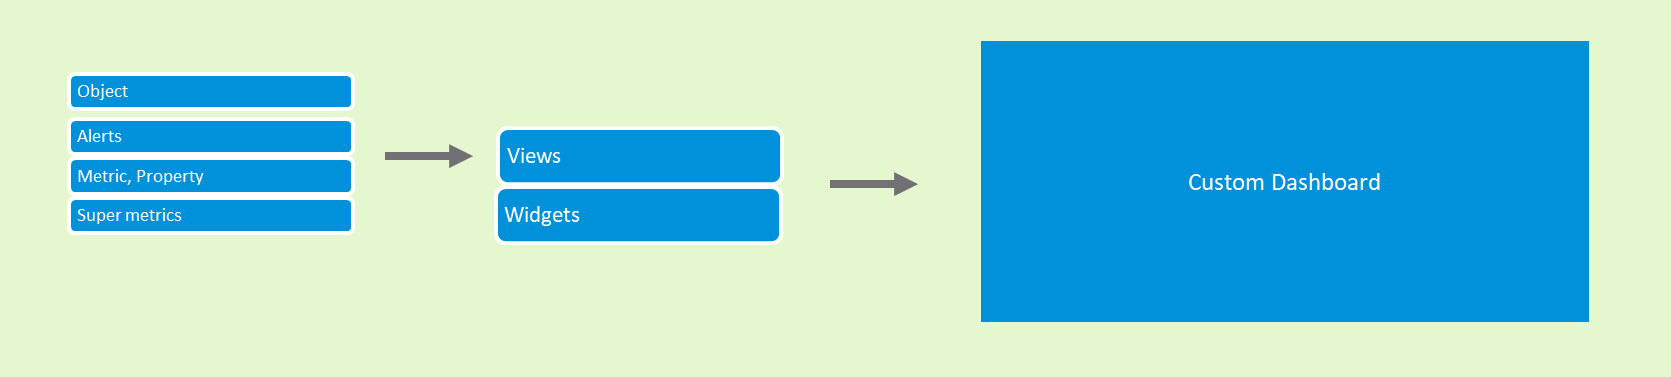
In simple form below are the most common items that are needed for populating a dashboard.
- Object (VM, Host, Cluster, Datastore etc)
- Alert
- Metric, Property
- Super metrics
- Widgets
- Views
Let’s describe our Dashboard and use case before going into creation steps.
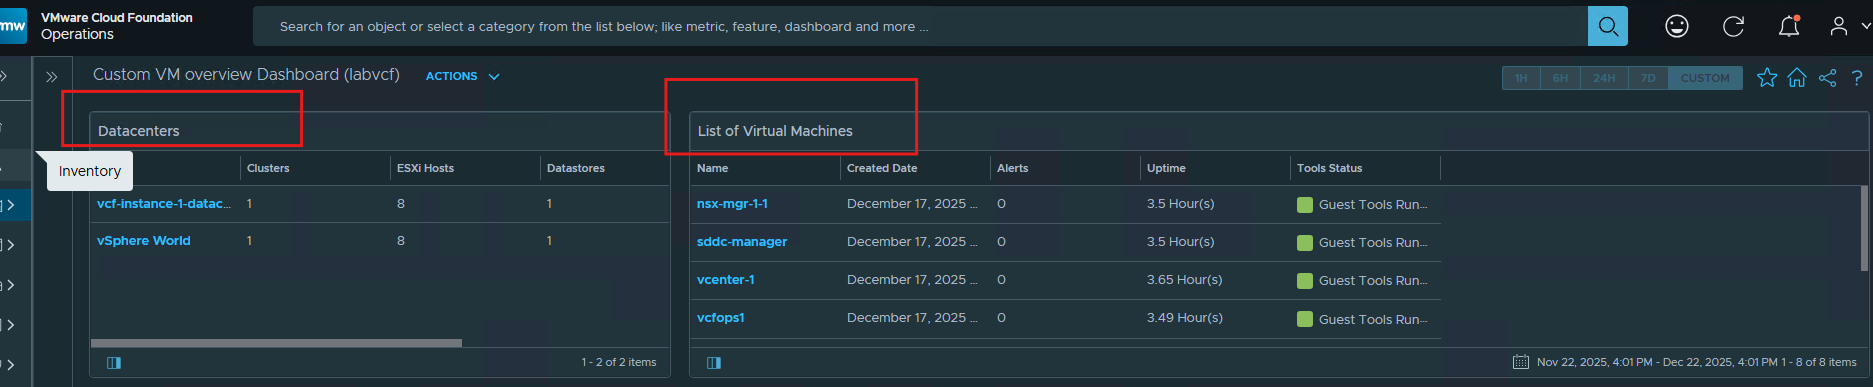
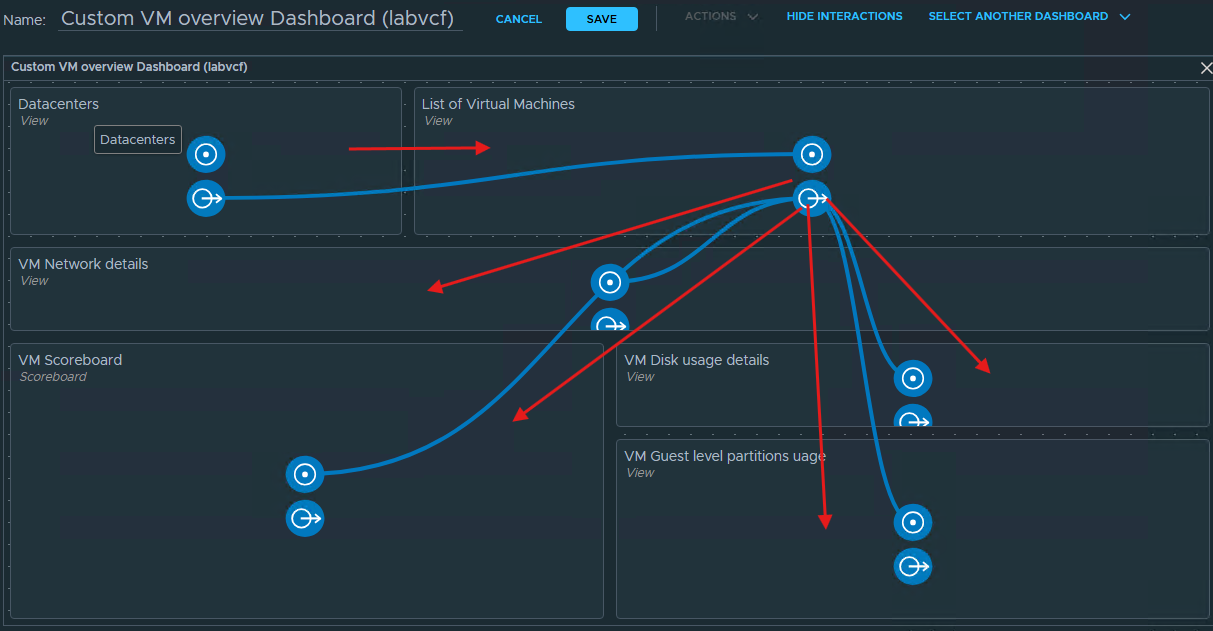
To keep the dashboard simple, the layout is divided into four horizontal rows, with 1 or 2 widgets per row. Each row has a clear purpose and guides the user from high-level context to detailed operational insights.
- Row 1– Data center and VM view
Here you can select the datacenter and then select the VM. Remaining widgets populate based on the selection.
- Row 2– VM Network Details
Once the VM is selected, VM network configuration details will be populated.

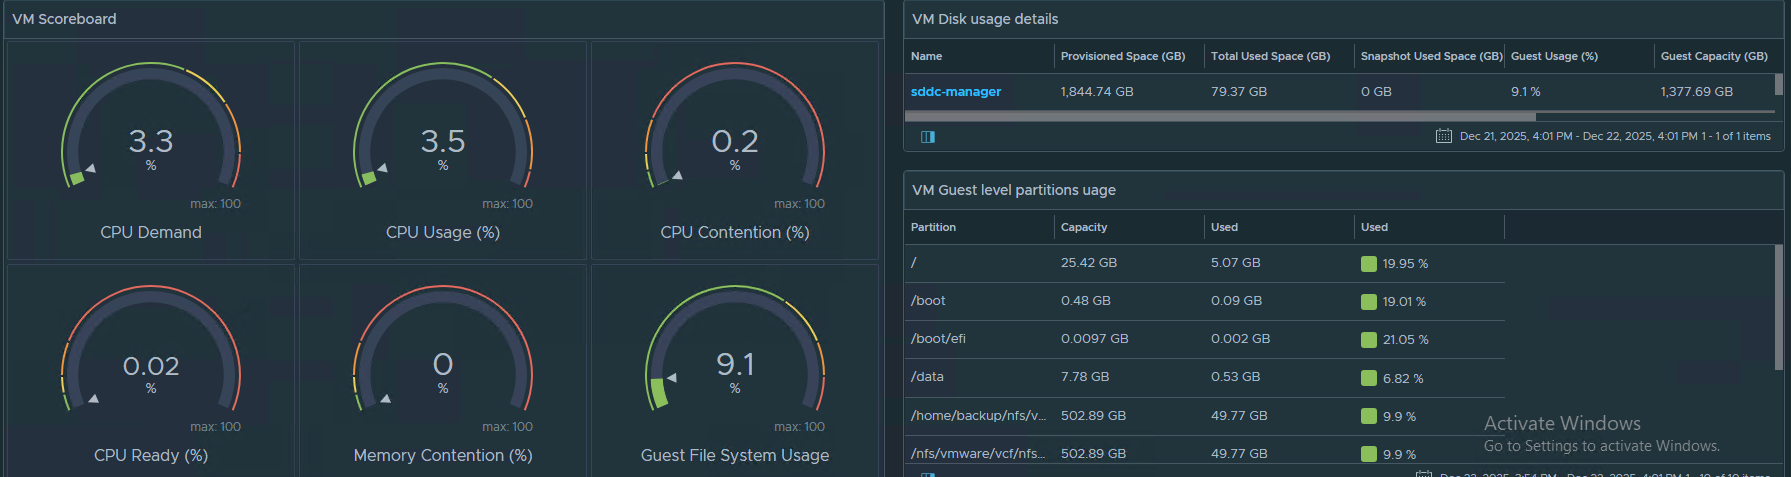
- Row 3 and 4 – VM score board and VM Disk usage
Here we have quick scoreboard to quickly gauge the VM performance factors like CPU contention, Memory contention etc.
We can also see the VM storage usage details like provisioned Space, Snapshot usage, Guest total usage and Guest level partition usage details.
Here is the interaction view of my dashboard:
Using this approach, we can leverage either default views or custom-built views as data sources for widgets and configure interactions between widgets to dynamically populate the data. While this dashboard is intentionally kept simple to demonstrate core dashboard behavior and navigation, it establishes a strong foundation for building more advanced, customer-specific dashboards tailored to diverse operational and business use cases.
Quick look at vCommunity ManagementPack
Another approach for creating dashboards is to use the Management packs. Recently VCF-Operations-vCommunity Management Pack developed by Broadcom TAM Onur Yuzseven has gained attention for its excellent capabilities. There is a great blog which already covered many details on this management pack. But I would like to get hands on with this Management pack and share my observations, insights and learnings from working with it.
We can download this management pack PAK file from here
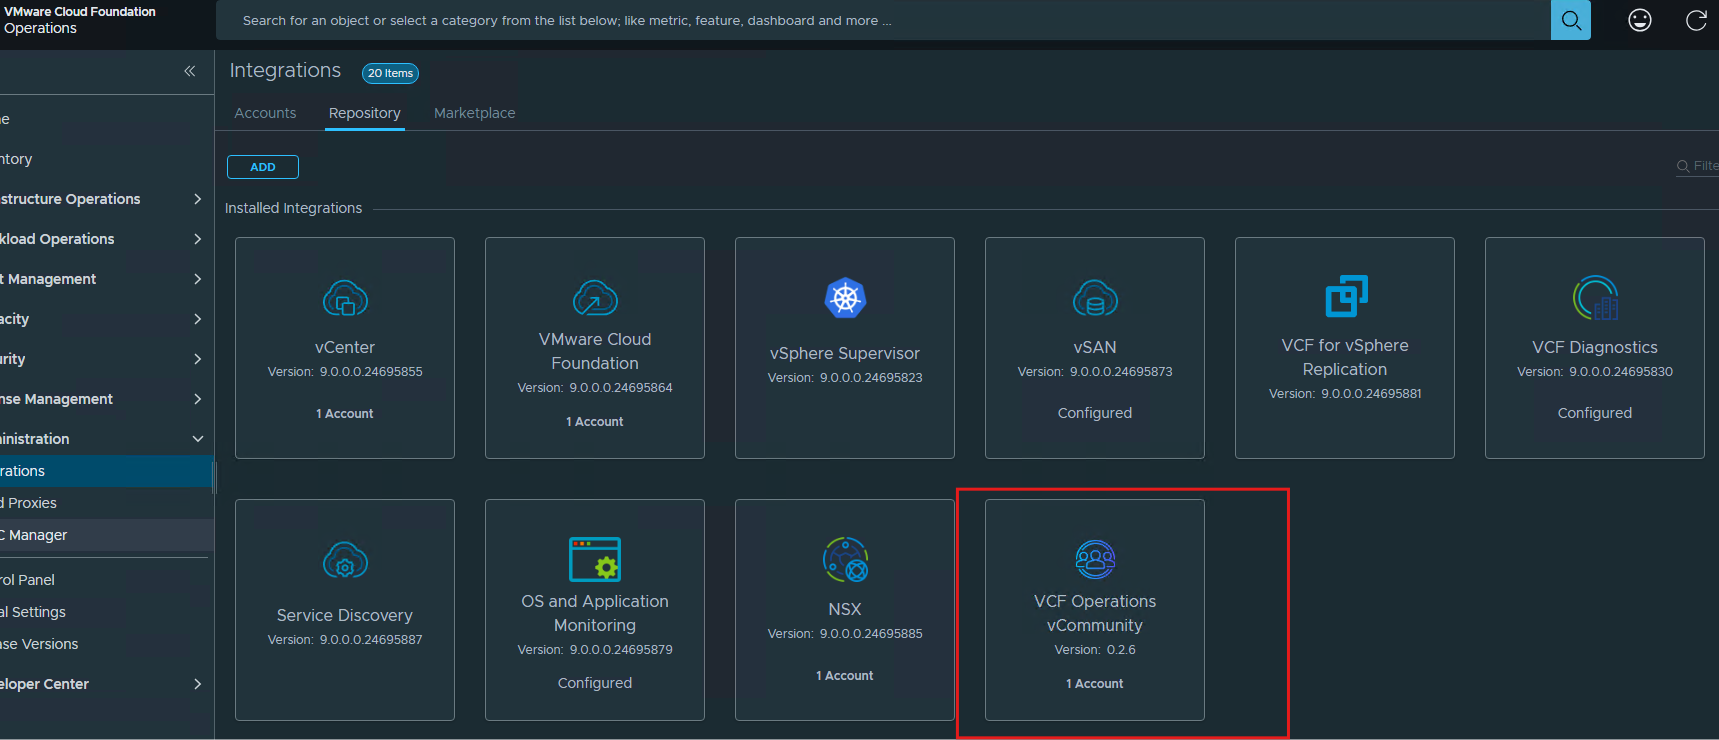
Then login to VCF operations, navigate to Administration section –> Integrations –> Repositories then upload the PAK file and install the management pack.
By default, VCF operations dont allow installing un-signed PAK files, so please follow this KB to allow the Unsigned PAK installation.
I have installed the management pack already, installation is smooth. It is showing in my repositories and I have configured the cloud account for this.
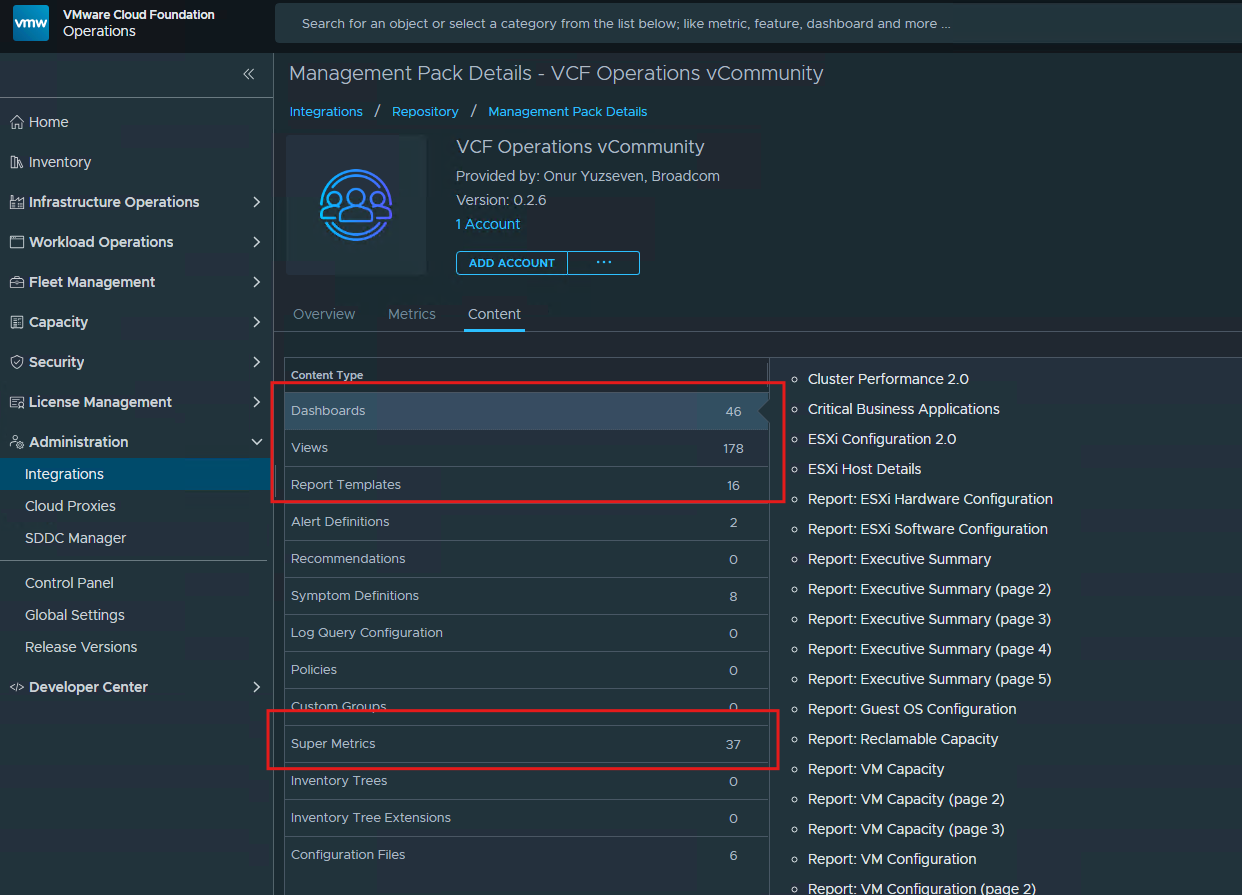
We can see how many pre-created dashboards, views, Report templates, and Super metrics are available with this management pack.
I found the ESXi Configuration 2.0 dashboard to be particularly well designed, as it provides a single, consolidated view of key ESXi details such as the ESXi version, BIOS version, hardware model, CPU model, and hyperthreading status. If this dashboard aligns with your needs, it can be used as-is, or alternatively, it can be customized or recreated to suit specific requirements.
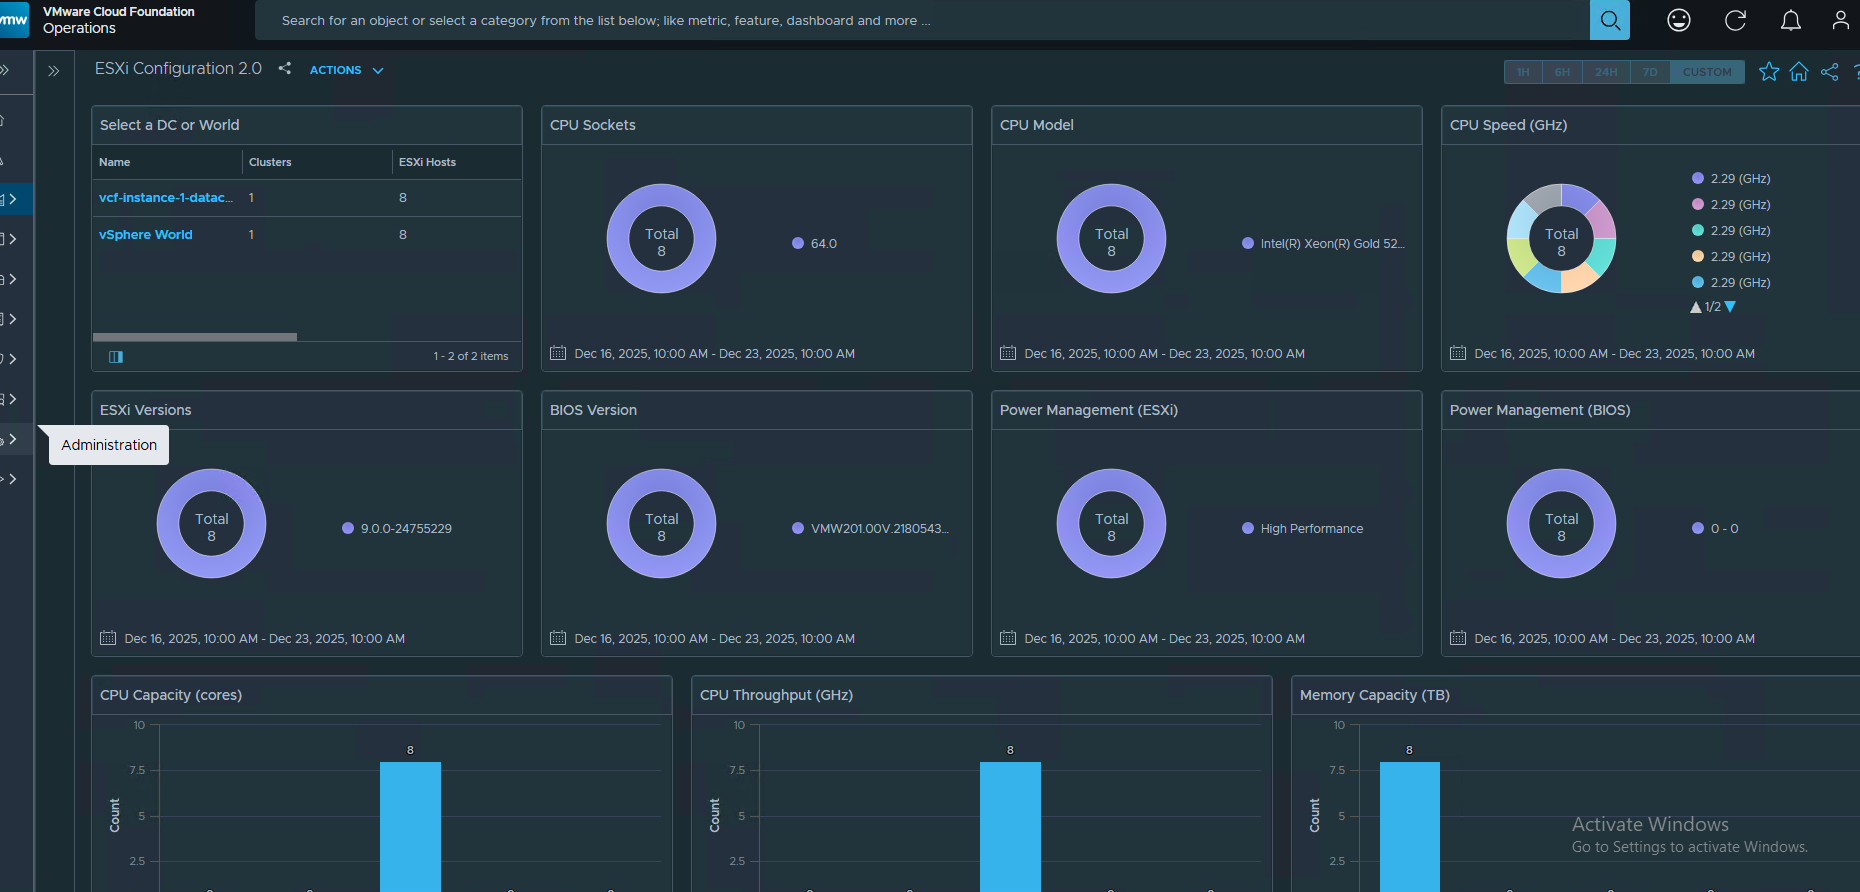
For example, if we want to look at few advanced settings of the ESXi host, we can see that in the dashboard itself without needing us to login to vCenter.
This vCommunity Management Pack comes with the configuration files like below:
I have cloned this and uncommented the advanced settings which I want to monitor in the dashboard.
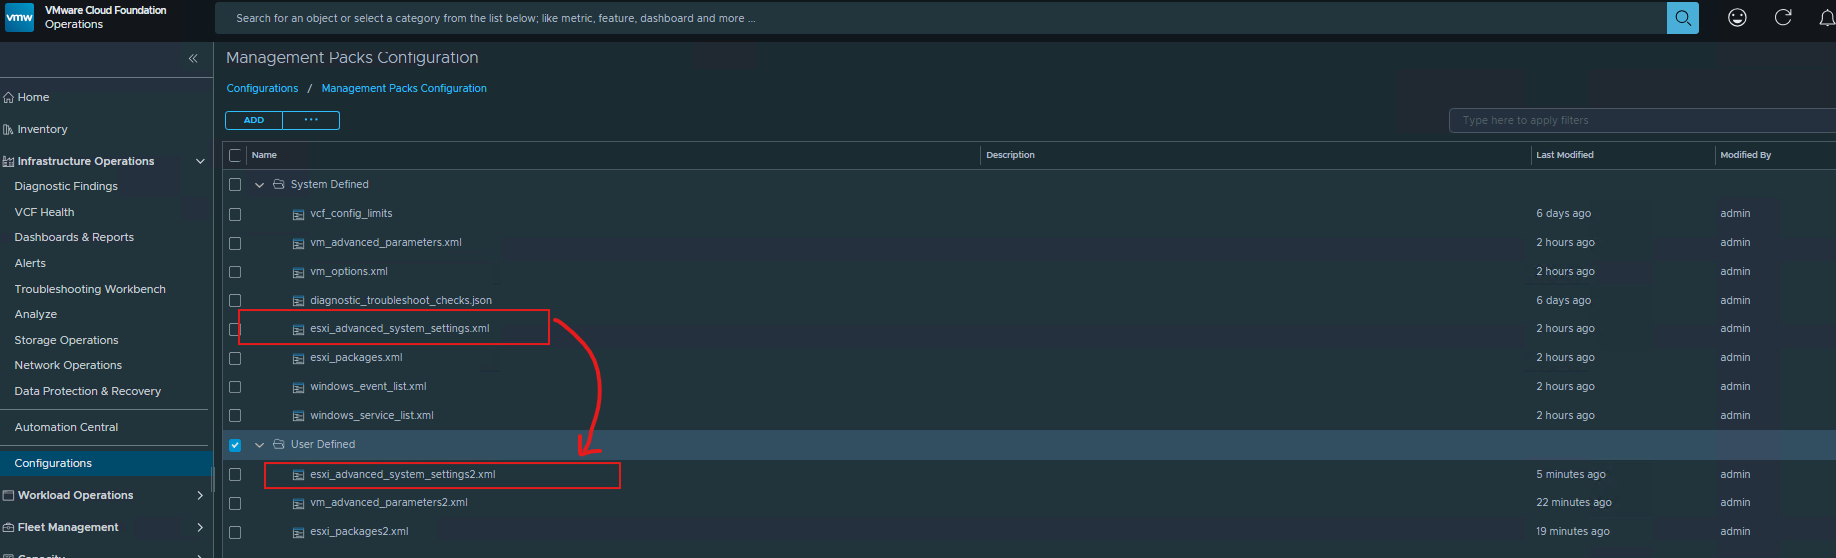
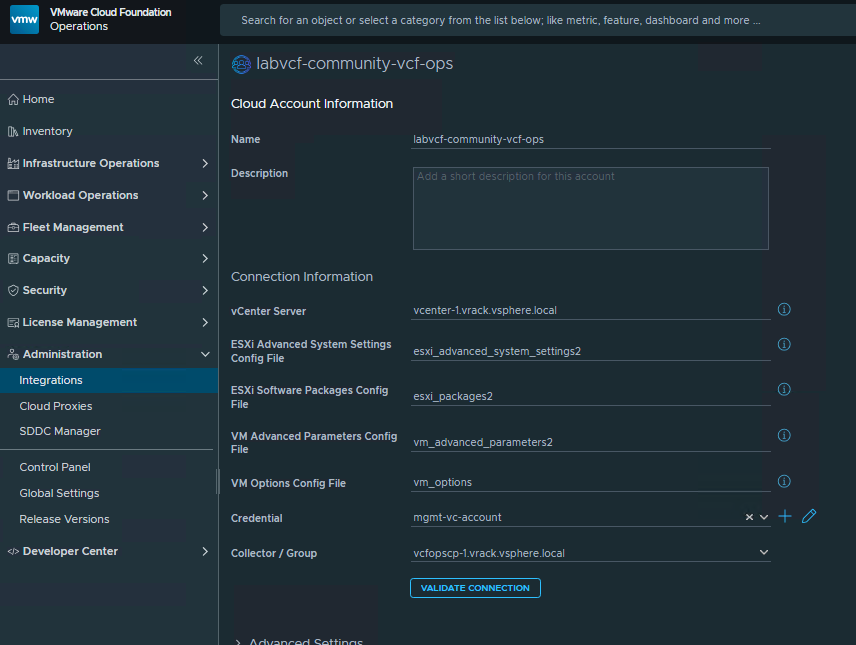
After updating the MP configuration, we have to update the cloud account to use this new xml file. In the same way, we can clone and update the other config files like vm_advanced_parameters and vm_options, esxi_packages etc. once it is done, we can create new property list widget and add it to dashboard.
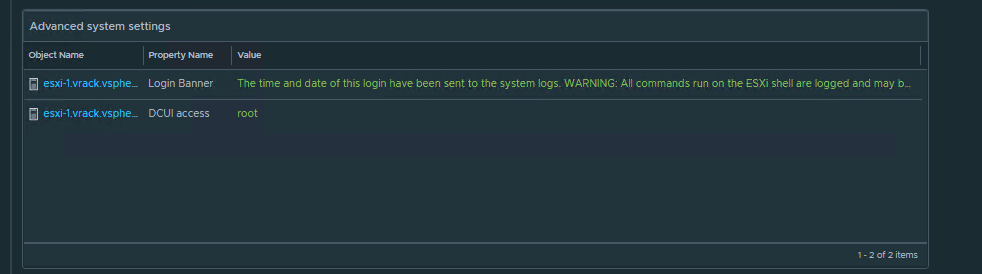
Here I have created a widget which displays motd and dcui access values for the selected ESXi host.
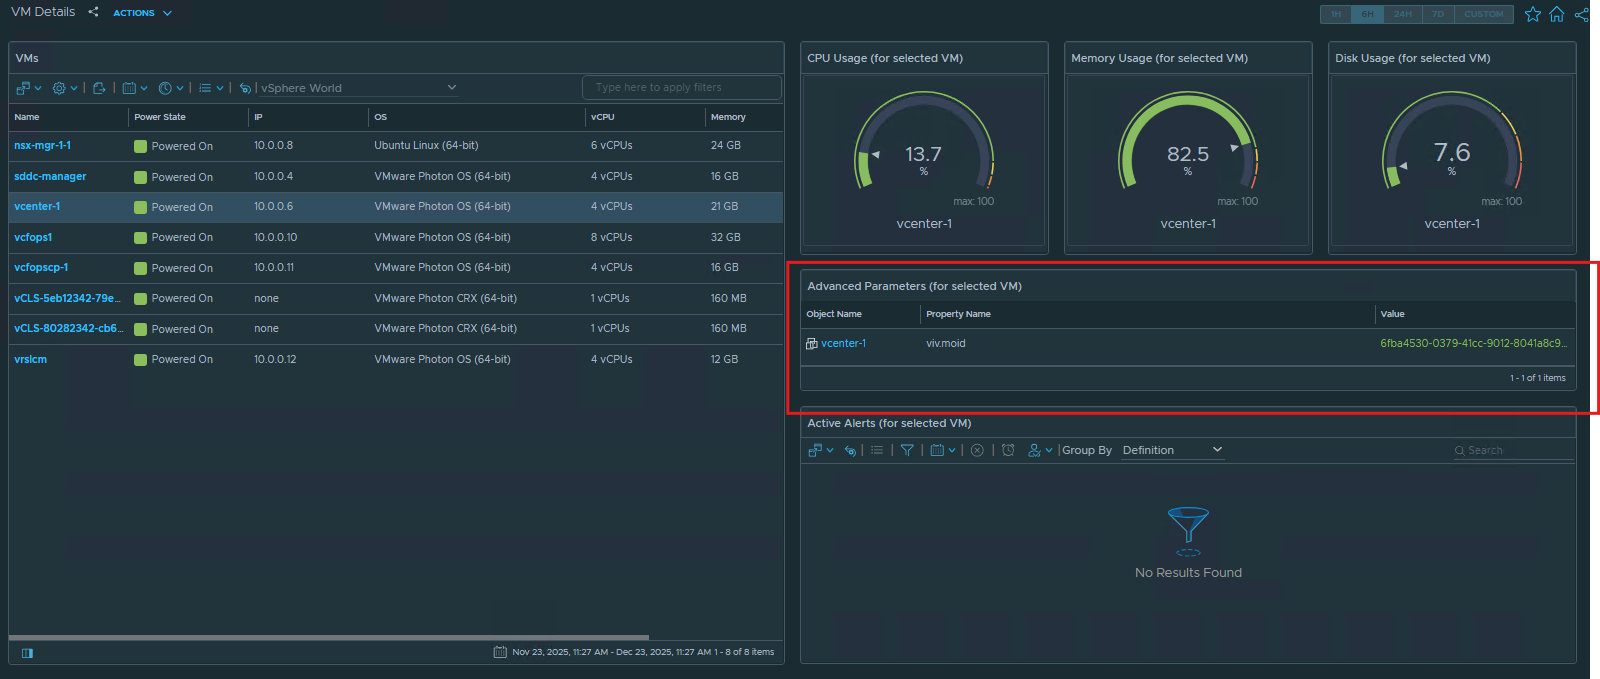
I have created an additional widget for the VM Details dashboard. This widget retrieves VM advanced settings for the selected virtual machine; for example, it displays identifiers such as the MOID and UUID of the selected VM.
Like this we can track different advanced parameter settings for your ESXi hosts, and Virtual Machines. We can also track which VIB packages are installed on the ESXi host.
This vCommunity Management pack is very customizable and very handy for implementing the custom dashboards for various customer use cases.
Using this approach, we can track various advanced parameter settings across ESXi hosts and virtual machines, as well as monitor the VIB packages installed on ESXi hosts. The vCommunity Management Pack is highly customizable and proves to be extremely useful for building custom dashboards tailored to a wide range of customer use cases.
For additional use cases and examples, please refer to the blog linked below.
That concludes this blog. Thank you for reading.
I hope it provides you a basic understanding of how to create custom dashboards in VCF Operations.